Executive dashboard for a consumer goods company
Problem statement
Design an executive dashboard for a CPG company that enables leadership (C-suite) to understand business performance, diagnose underlying issues and decide what action to take.
The dashboard should be interactive and accommodate data cuts across geography, channel, category, brands and more. It must have internal data as well as data from external sources and should be a single page.
Approach
First, we define our users: CEO, CFO, CMO, CSO (sales), COO. For simplicity, CBO (Brand) and CMO are merged and COO also assumes manufacturing & procurement responsibilities. I have excluded C-suite like legal, tech, HR. Next, let’s define the job-to-be-done (JTBD) for our users. There are 3 main jobs:
- What is the data? Defining the key metrics that capture business performance and calculate their values. This has to be contextual to each user and their main responsibilities.
- What does it mean? Explain what the data says about the business’s performance. What’s doing good/bad and why?
- What action to take? Suggest the best action to take next, identify who needs to take the action and enable users to take it.
Solution
Here’s how we will achieve each of the JTBDs.
#1 What is the data
While several metrics are available, CXOs’ time is limited. Hence, the real goal is to enable a T-shaped consumption for them for day to day use- A fast broad view of parts of the business they manage and an easy deep-dive in any area of their choice. To enable this, we define a hierarchical set of parameters (L1 (4) >> L2 >> L3, see the metric pyramid) that cover any and all changes in their individual function. Eg- For a CEO, Organic sales growth (L1) > [[ Volume + Price/mix] (L2)] + ... Lastly, for each of the metrics, we enable multiple views: Against last year, against plan, target, etc.
All this data comes primarily from 3 sources, external data from market tracking agencies, internal past data and context from company data pipelines and internal forward-looking estimates/targets from RGM/TPO tools.
#2 What does it mean?
A good insight goes beyond telling what’s good or bad, and explains WHY it is so. Eg- Organic Sales Growth for Orchard Juice is 3.5 pts behind plan in Indonesia. But the real insight is: late inbound shipments mean we can’t supply enough, so fill rate is near 82% and we are losing sales even though shoppers want the product.
An AI agent will make this happen. Not just implemented AI in some sections. The agent will autonomously define the views, the metrics, etc. It will be told to balance stability with visibility. In this prototype, the agent is simulated with rules on synthetic data.
Issues/Insights here are intentionally designed to be presented in the logical way the user approaches the data, which is - Metric that is off >> by how much this metric is off >> Current value v/s Goal value (annual target/monthly target etc) >> the underlying reason why this is off.
#3 What action to take?
The most crucial job of the dashboard is to enable the user to take action on the most burning issues to fix them. This includes identifying the person responsible and being able to work with them until resolution. That’s why it is important to track the issue x action over time and also nudge the owner for action/updates. Eg- Email Indonesia Supply Lead to expedite inbound shipments for Orchard Juice, Indonesia to get fill rate back to 95% in 3 weeks.
To enable users most effectively the dashboard is integrated in very specific places with tools/products they use. Eg- A CSO can recheck sales targets with new prices using the RGM product integrated into the flow.
Usability enhancers
Aside from viewing data and sending actions, users also need some enhanced actions to improve use.
- Bookmarking Users can bookmark charts and analyses to revisit them or for regular tracking.
- Deep custom analysis (Talk to your data) Occasionally, a user might require a very specific, deep analysis which is different from the dashboard. We have enabled users to build an analysis based on the context they specify complete with a value tree and contextual filters. Users can save or share these as needed.
- Action follow-up One can also follow up on actions, especially those which are overdue.
- Alerts CXOs can set alerts on bookmarked charts to keep a watch on different metrics.
- Mobile view [roadmap] They can view key metrics and actions on a mobile screen when they are on the move.
Based on these we designed a dashboard for these CXO users. The company in it, Northstar Consumer Goods, is fictional and all data is synthetic.
How I built it
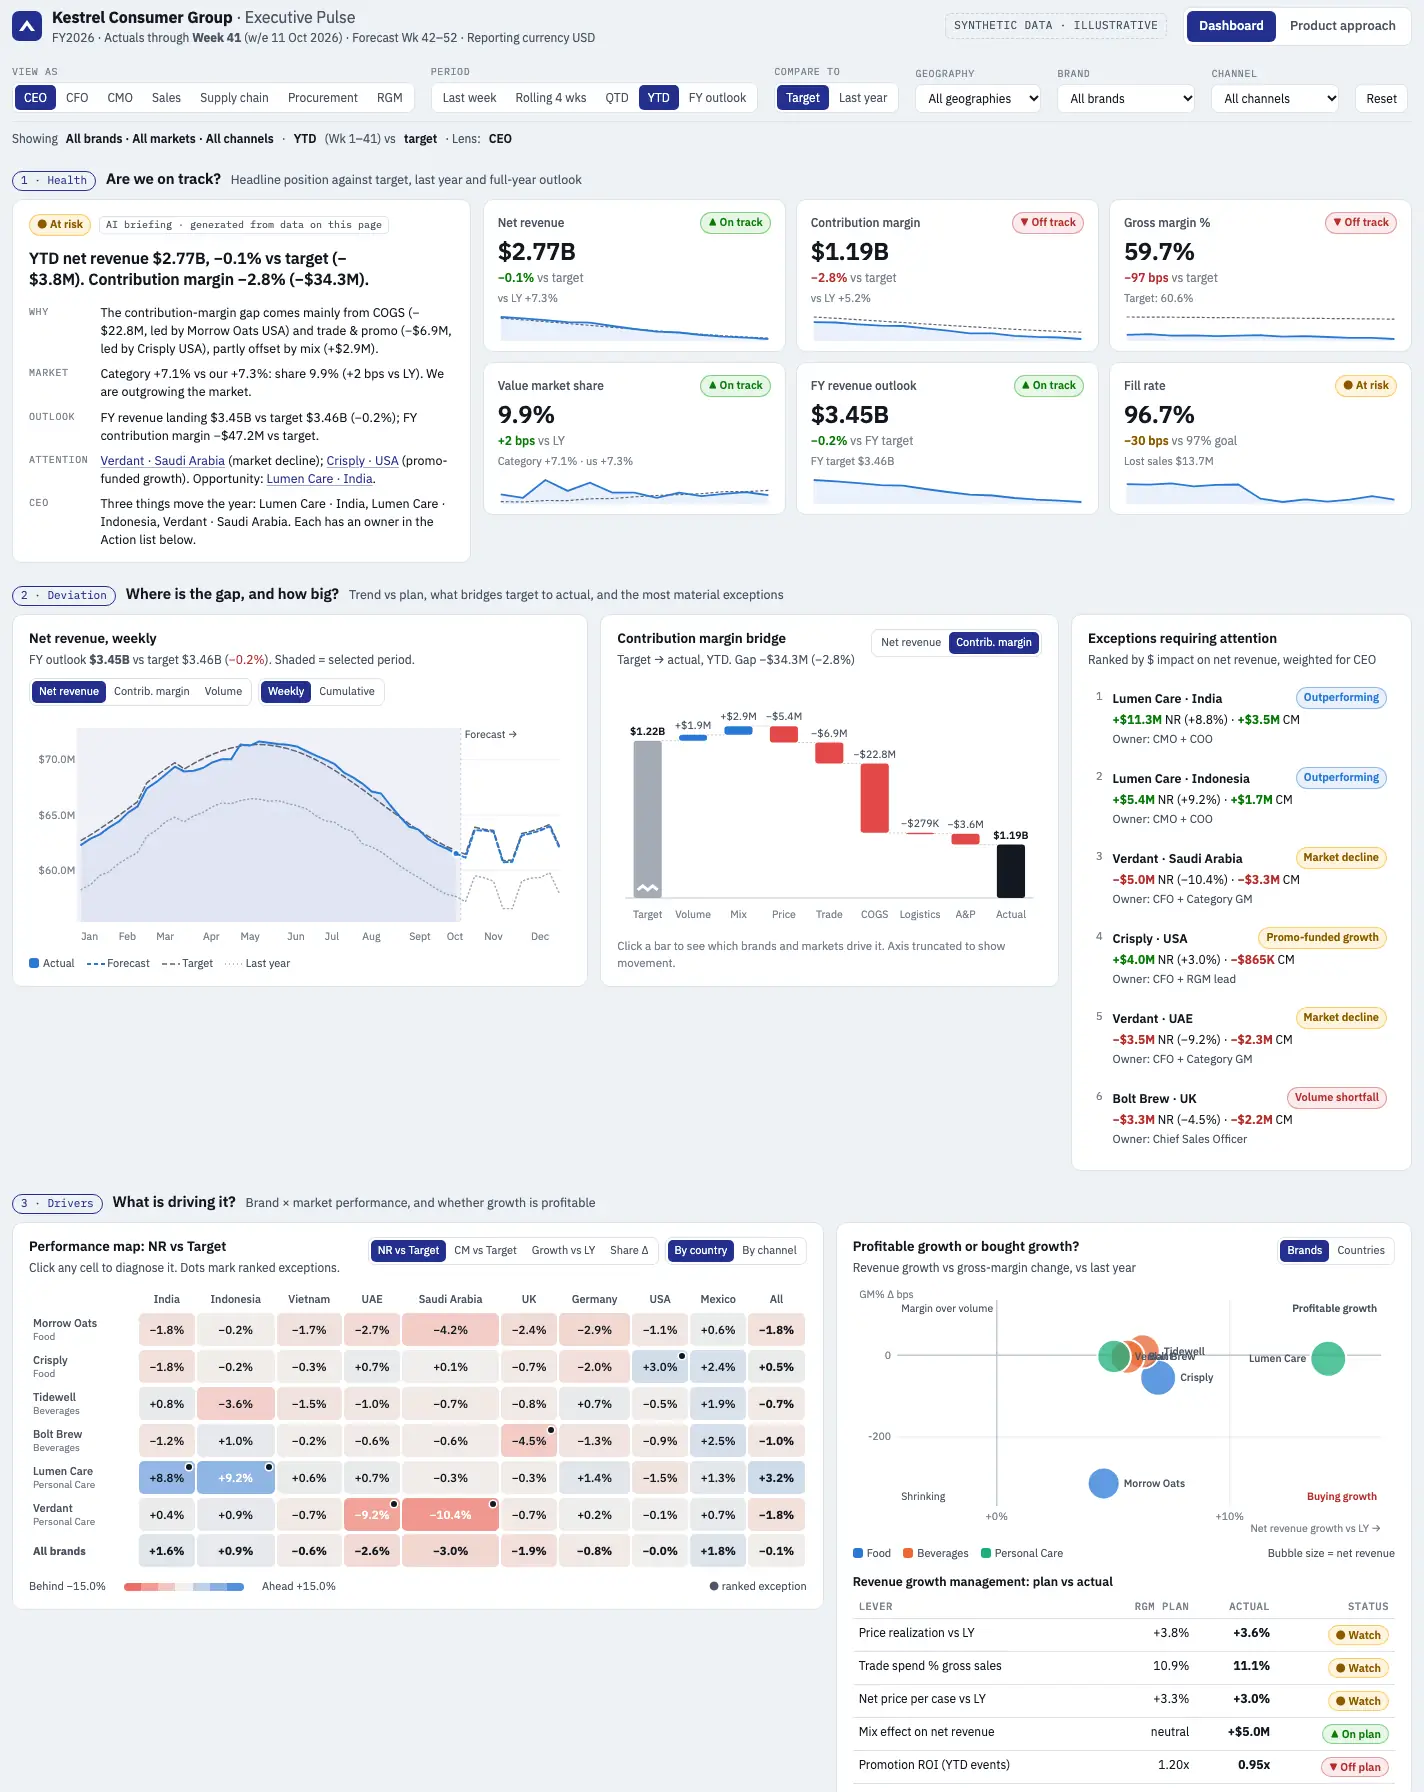
Pulse went through three versions before this one. Scroll to see how the thinking changed, with the pyramid and the dashboard side by side.
Start with the people
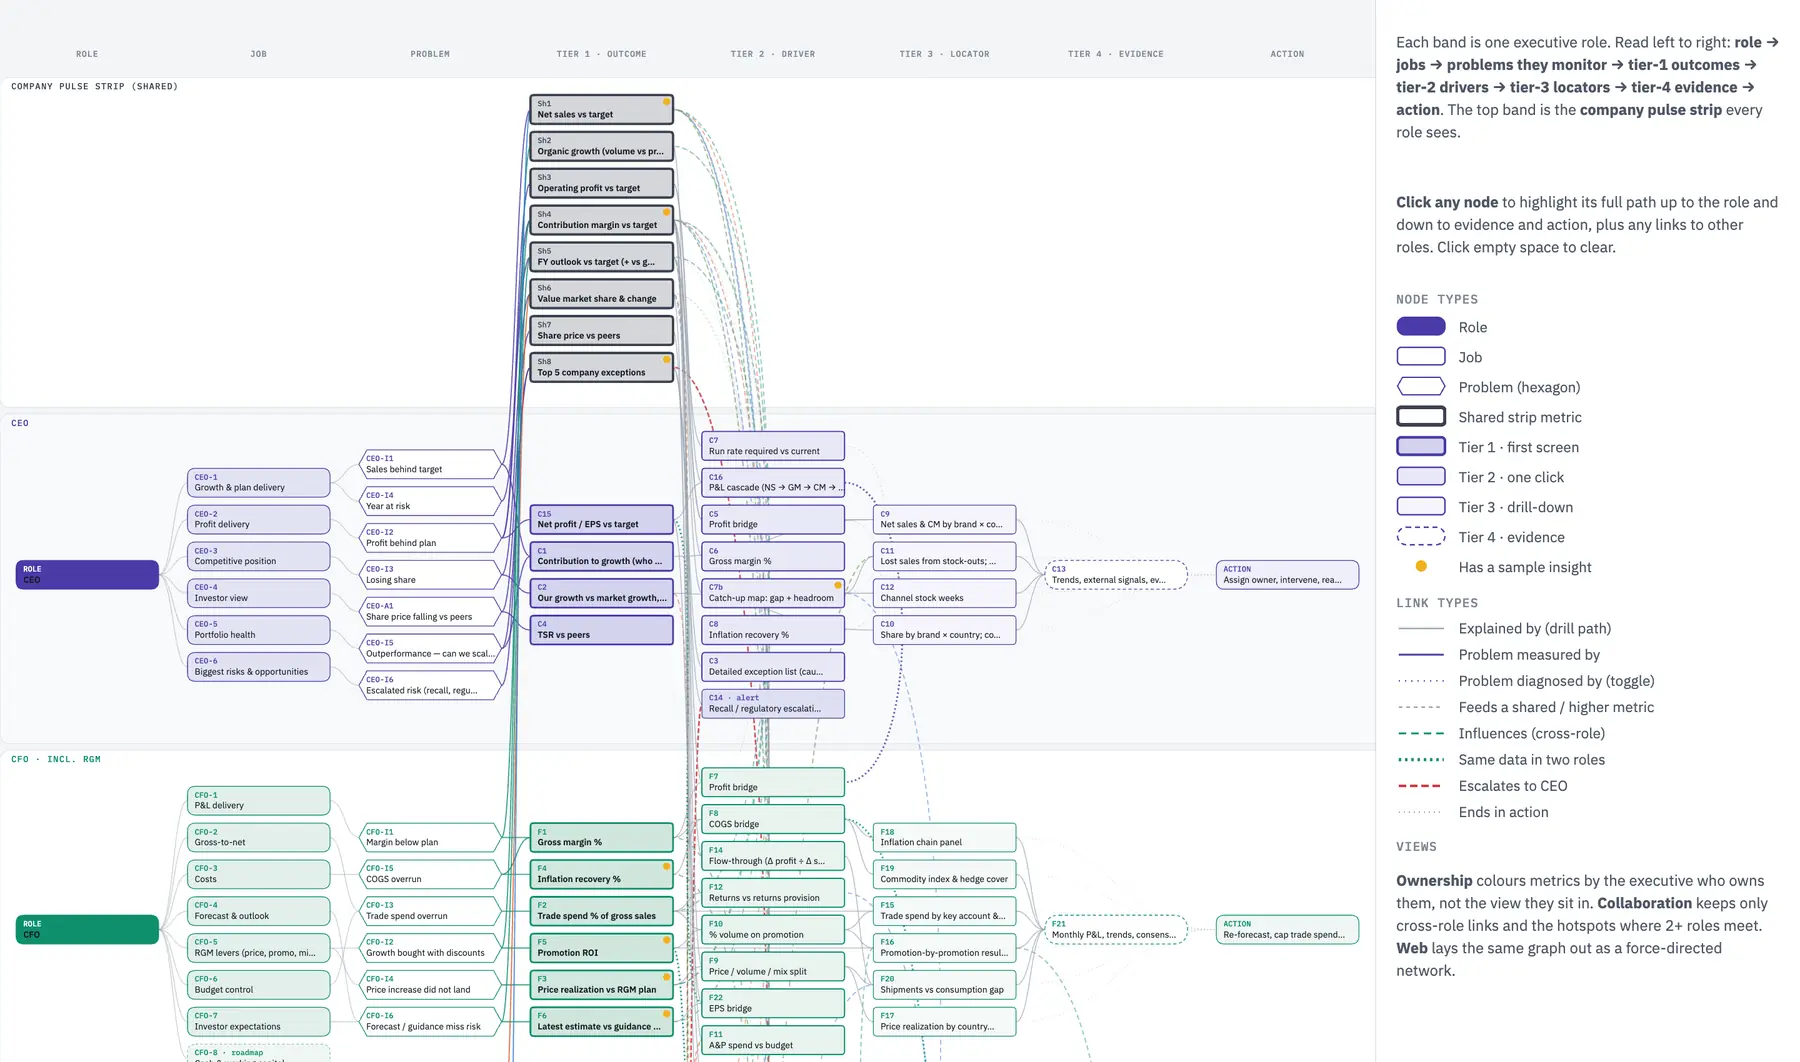
I started with the people, not the charts: five executives, the jobs they do, the problems they watch, and the metrics behind each problem, four tiers deep, ending in an action.
Each role became a profile: what they are paid on, what they worry about and what they can change. The CEO alone had six jobs and seven problems to watch.
The threads mattered most. Click any metric and only its flow lights up: the role and problem above it, the action below it, and every other role it touches.
Take inflation recovery, behind the oats story. It sits under the CFO’s costs job, answers “COGS overrun” and ends in an action: re-forecast and cap trade spend.
The panel names the owner, the CFO, lists procurement’s input cost as what feeds it, and flags a collaboration hotspot: two executives have to act together. That is where shared ownership lives.
Version 1, and why I scrapped it
Version 1 followed the brief: are we on track, where is the gap, what is driving it. The structure was right, and a core metric reached its cause in three steps.
But it was a sea of charts. Too many metrics, no T-shape for an executive with 5, 15 or 50 minutes, and no clear owner where two roles share a number.
“The executive’s job is not to be lost in a sea of metrics.”
Version 2: fewer, better metrics
So I cut. Four core metrics per role, checked against what CPG companies report to shareholders and pay their executives on, not what I remembered.
Version 2 put them on one calm page: a short summary, four core metrics and my actions. Five minutes to know where you stand.
Version 3: let the executive review it
Then I stopped guessing what a CFO would think. I wrote a skill that thinks like a CPG CEO, CFO, CMO, Chief Sales Officer and COO, and asked it to review. Its verdict: the home page worked, the trees underneath did not.
Version 3 rebuilt every tree on three rules: each level adds up to the one above, every lever has one owner, and “where” is a cut of the data, not another metric. The top of each tree is a card on the home page.
Design: less, but better
Design ran as its own loop: explore directions, have an independent critic judge screenshots only, then subtract. Each round removed something, like the same fact shown three times or red doing six jobs.
Adapted from Anshu Chimala’s How to turn your AI into a world-class designer on Lenny’s Newsletter.
The final version, used
A CEO opens Pulse. The summary leads with what needs attention: Sunrise Oats is $26.1M below plan on margin, and Orchard Juice in Indonesia can’t be supplied.
Operating margin looks only 16 bps off. Open it, and the walk shows why that misleads: gross margin lost 108 bps, hidden by an overhead freeze. It is the same chain as in the pyramid.
Cut to Sunrise Oats and it is 318 bps behind: oat costs are up 18% and the price increase is stuck at retailers. The fix is already assigned and three days overdue, so the email opens as a follow-up.
Orchard Juice is the opposite problem. Shoppers want it, but late inbound shipments leave fill rate near 82%. Down the same branch of the pyramid: sales growth, then volume, then sales lost to supply.
One click asks the Indonesia Supply Lead to rush the shipments, and drafts the email with the numbers behind it. Every action then lands in My actions with an owner and a due date.
Watch it work
The live dashboard, running one CEO morning on its own. Hover to pause, or pick a step.
The dashboard is built for desktop. Open it on a laptop to try it →
Four decisions that shaped Pulse
Each one is shown before and after. The numbers on the right match the notes underneath.
T-shaped browsing
Executives have 5, 15 or 50 minutes. The top of the T answers “am I on track?” in one screen; the stem lets any number open deeper without leaving the page.
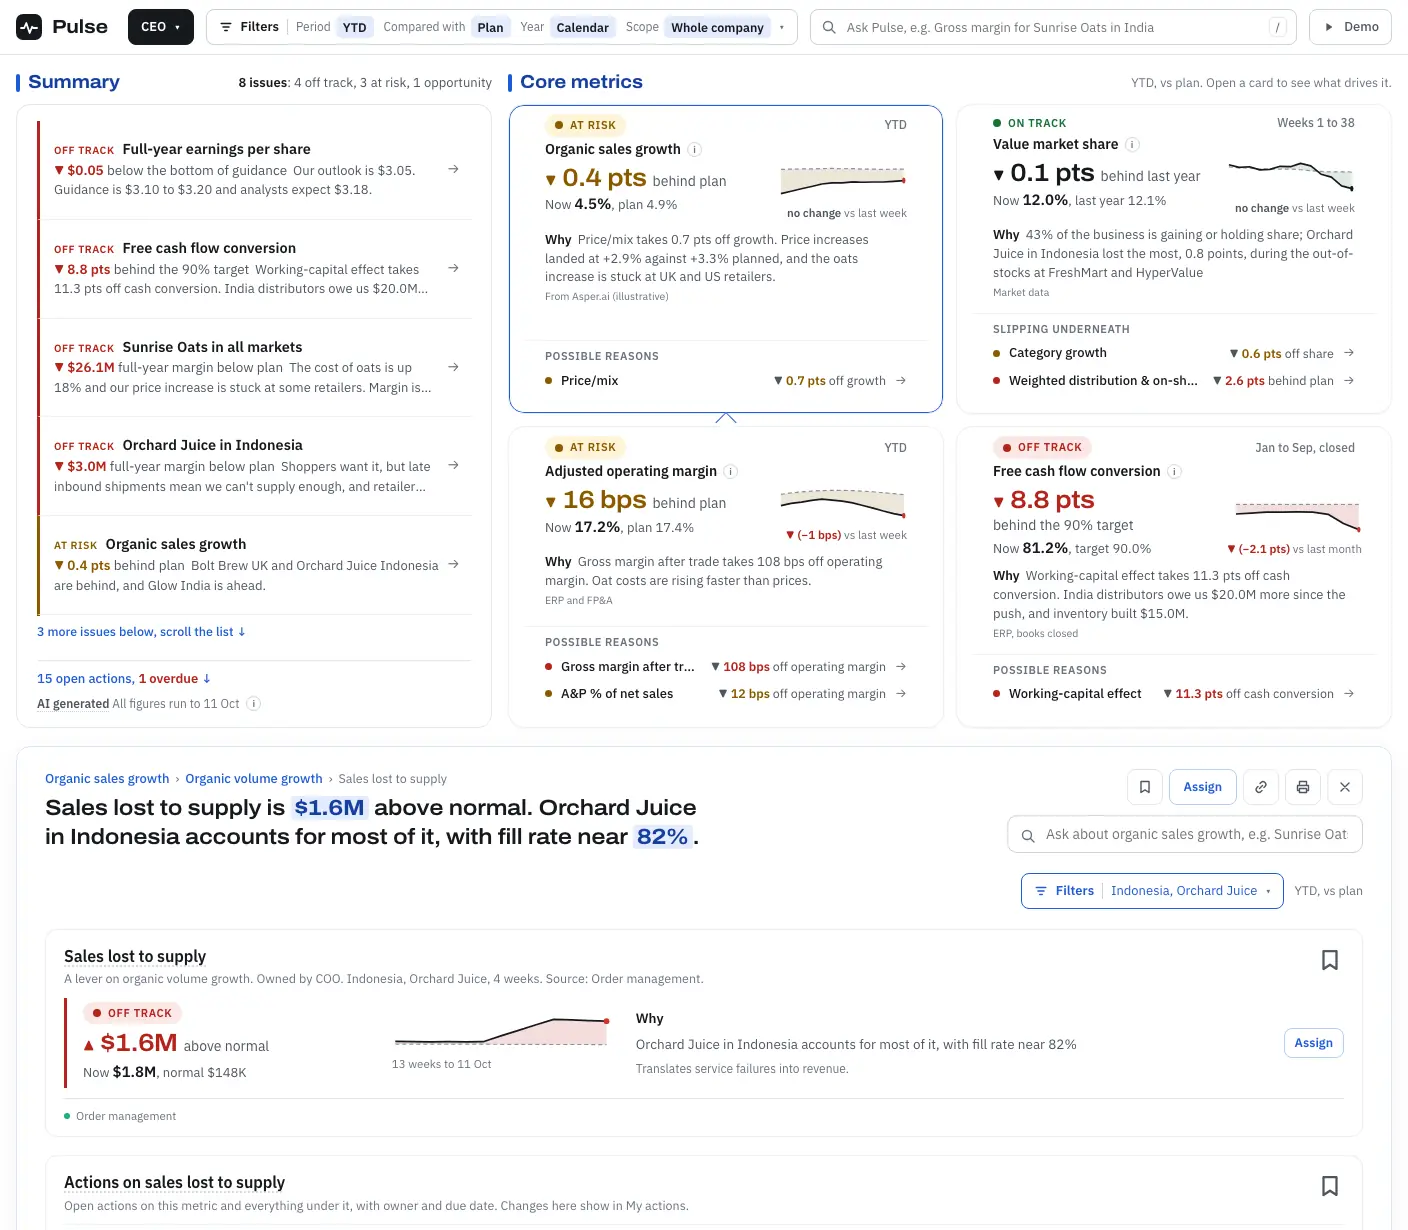
- The summary: what needs attention, worst first.
- Four core metrics cover the whole role in one screen. Together they are the five-minute check.
- Any number opens one level at a time, with a breadcrumb back up.
- The panel opens right under its card, so the home page stays in view.
- Filters belong to the panel: cut by country, brand or channel without losing your place.
Prioritising the metrics
The first node diagram had 94 metrics. The pyramid keeps four per role and makes every other number findable beneath them.
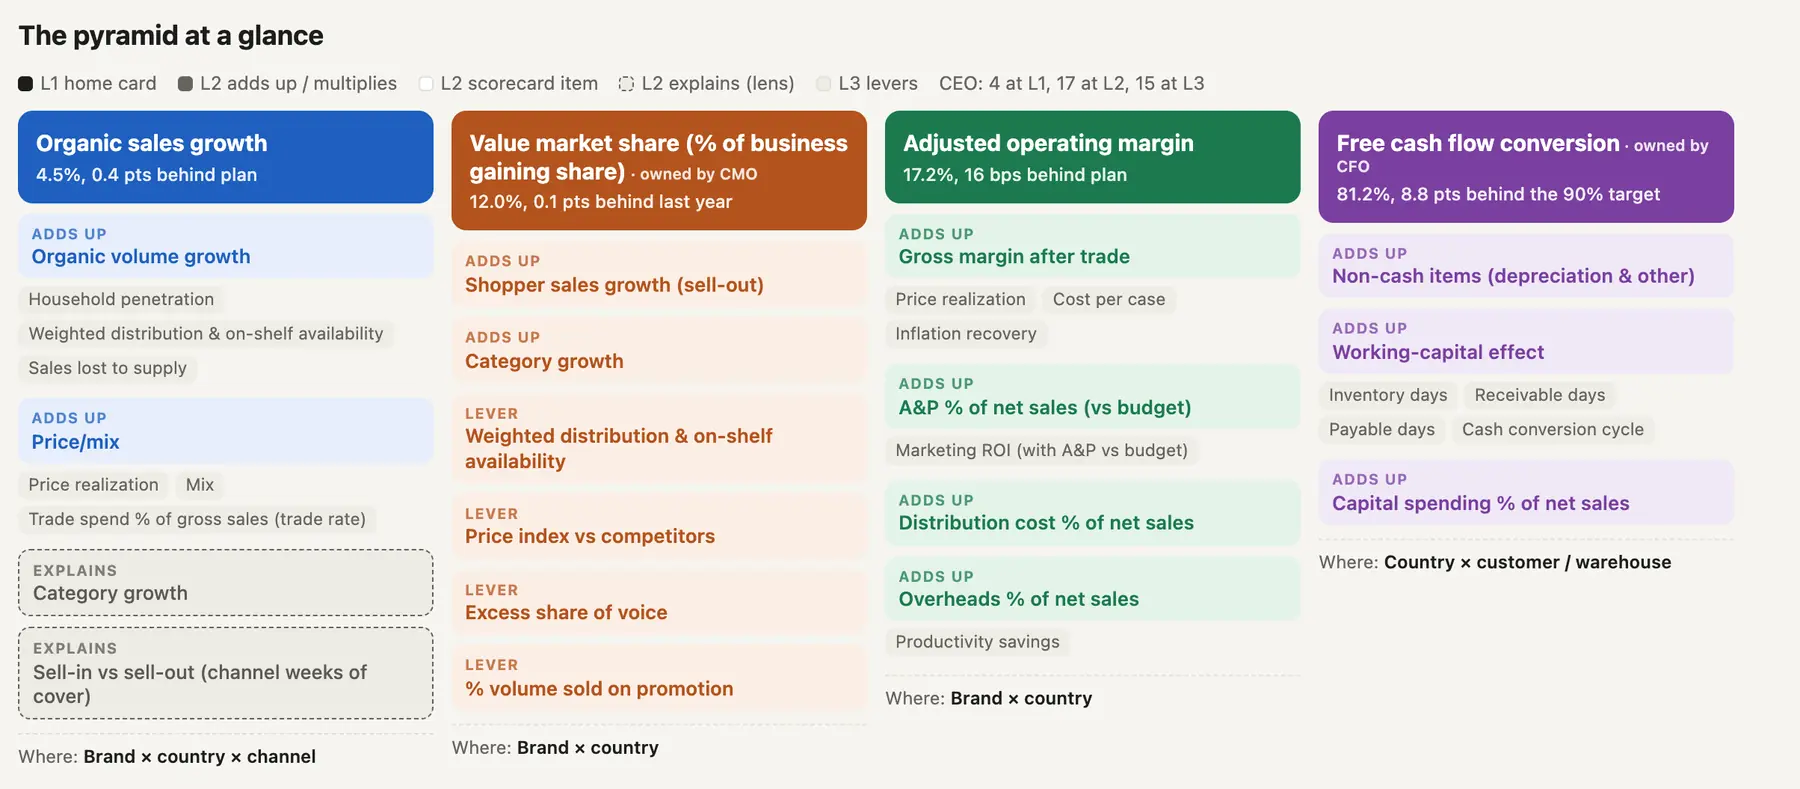
- Four core metrics per role, from what CPG boards measure and pay executives on: growth, margin, cash and share. Only what the executive can move.
- Parts add up: each level reconciles to the one above, so a gap always splits cleanly.
- Levers are causes you can pull, each with one owner.
- Lenses such as category growth sit beside the tree, never inside the sum.
- “Where” is a cut by brand, market or channel, not another metric. That alone removed dozens of metrics.
- Shared metrics have one owner: the CEO watches cash conversion, the CFO owns it.
Issues before metrics
An executive’s first question is “what needs me?”, not “what are my numbers?”. So the summary is a list of issues, and the metrics sit beside it as context.
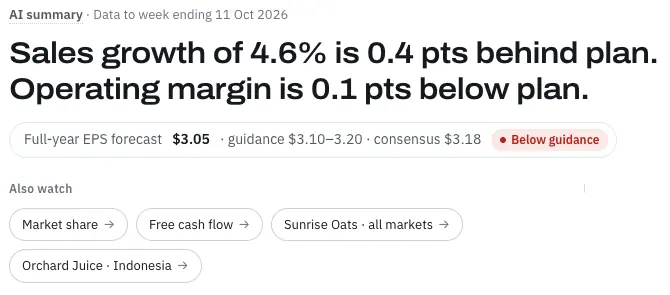
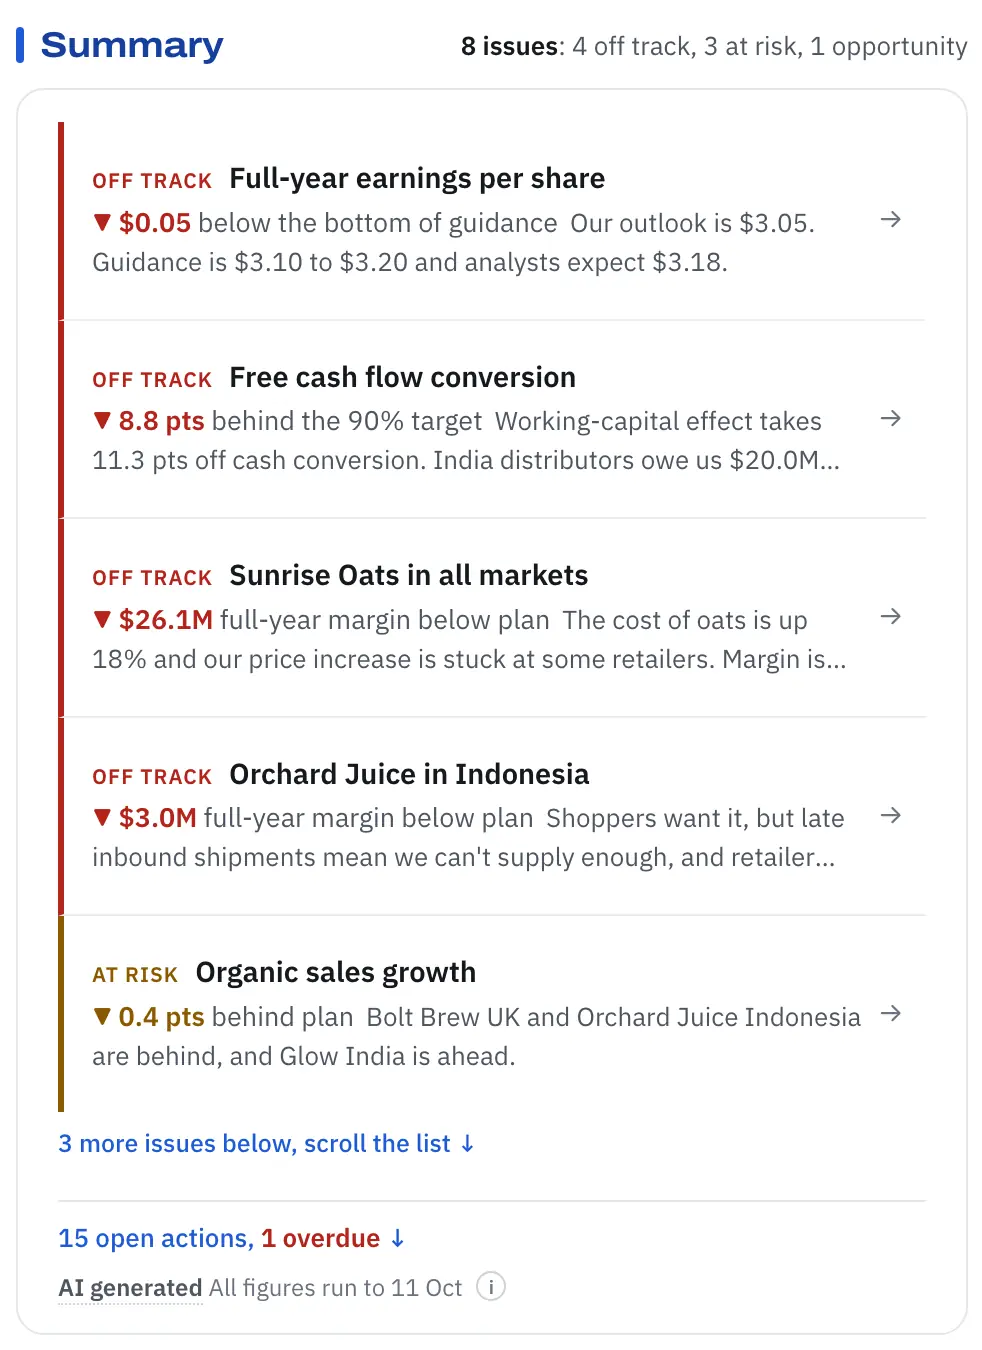
- How many issues, by severity, worst first.
- Each issue reads in the order an executive thinks: what is off, by how much against what goal, and why, in one line.
- Every issue opens its analysis.
- The actions on them are one glance away.
The metric card
A card should read the way an executive thinks: is it off, by how much, against what goal, where is it now, and why.
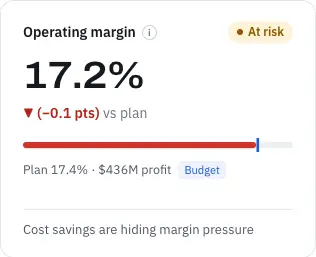
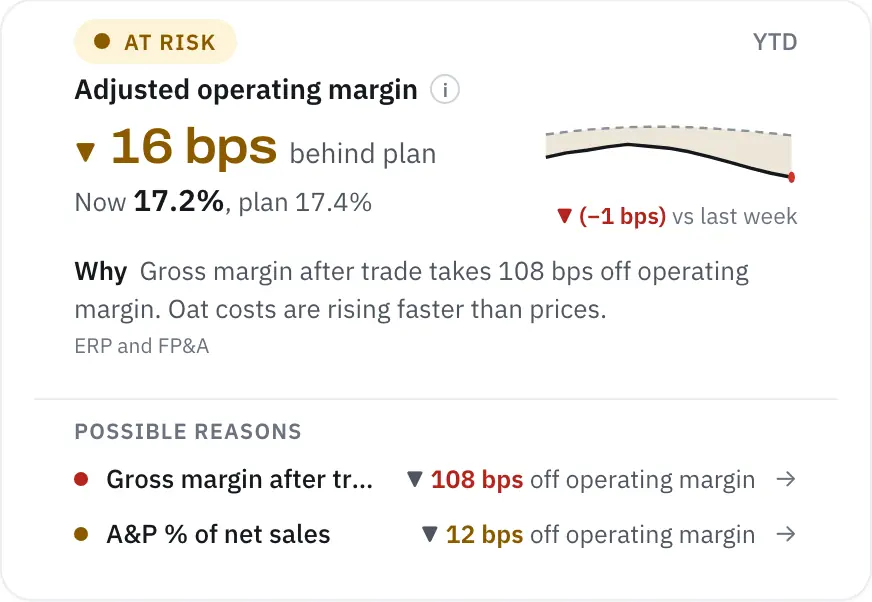
- Status first, coloured only when it needs attention, then the metric.
- The gap is the headline: how far off, against which goal. Then the value now and the goal.
- Trend, and the change since last week.
- Why, in one sentence, with its source.
- Possible reasons: the parts that moved it, each one click deeper.
What I learned
- Understand your users to the depth of how they will use it. They are the ones who have to like what you build, so it should feel custom built for them. That only comes from spending the time to understand them.
- Structure before detail. A product manager is expected to go down to the smallest detail, and without a solid structure it gets overwhelming fast. Structure well, prioritise hard and decide how deep you want to go.
- Good design is not optional. Model what your users expect, and remember that less is more. Most people can tell bad design from good but can’t say what is wrong. Seeing that is the product manager’s job.
- Building skills with AI compounds. Writing reusable skills was not an incremental gain, it was exponential: every skill made the next round faster and better.
The skills I built
Both skills are available on my GitHub.
- CPG executive critic. It thinks like a CPG CEO, CFO, CMO, Chief Sales Officer or COO: their priorities, rhythms and decisions. It reviews any dashboard element by element, through that executive’s eyes.
- Design studio. A design process for any page or app: explore varied directions, have an independent critic judge screenshots only, then subtract and polish. Adapted from Anshu Chimala’s How to turn your AI into a world-class designer on Lenny’s Newsletter.
Early versions were called Kestrel; the name changed to Pulse in version 2. Northstar Consumer Goods, its brands and all figures are fictional.